Improving outcomes takes practical skills, structured methods and the ability to learn from data. This page explores the core approaches that drive meaningful, measurable improvement. From hands-on PDSA cycle problem-solving to strengthening your measurement and data interpretation capabilities, you’ll gain tools to test changes, analyze results and accelerate progress. We also introduce foundational improvement frameworks, including the Model for Improvement and Breakthrough Series Model, with a deeper look at the Breakthrough Series Model (BTS) and how it supports collaborative, large-scale change.
PDSA Cycle Skill Building
Rapid cycle testing is a standard tool in quality improvement (QI) using iterative Plan-Do-Study-Act (PDSAs) cycles to convert ideas into action. When doing QI work, you must have the following information to successfully conduct PDSA cycles:
Aim: Understand the overall purpose of the test
Measures: Determine ways to collect feedback to ensure a change is an improvement
Generate Ideas & Plan: Brainstorm ideas and theories for potential commonality
Study: Assess the feedback
Act: Adjust your theory (if needed) to plan your next test
The following resources can be used in your rapid cycle testing work:
- Templated form to assist teams with tracking PDSA tests and documenting outcomes: AAP Quality Networks: Blank PDSA Form
- Avoid these common mistakes when beginning to implement PDSA cycle testing: How to Avoid the Most Common Pitfalls in Planning PDSA Cycles
- PDSA testing is an iterative process. Review these tips to successfully move onto your next cycle of testing: 9 Tips for Moving from One PDSA Cycle to the Next
- The “Planning” (P) stage is one of the most important steps in rapid cycle testing. Here’s some helpful reminders when planning a test: Mastering the Planning Stage of PDSAs
- To ensure successful small tests of change, keep these tips in mind: 5 Tips for Testing to Optimize Your Next PDSA
- Remember to keep tests small and don’t overthink it: How to Avoid Analysis Paralysis and Underplanning in PDSAs
Measurement and Data Interpretation
Measurement and data analysis are fundamental components of quality improvement. Data are necessary to determine if changes are leading to improvements in processes and outcomes.
The resources and tools below provide guidance on developing a sound quality improvement data strategy:
- NICHQ - Why Data Collection is a Necessary Part of Quality Improvement: The National Institute for Children’s Health Quality (NICHQ) briefly summarizes how data are used to inform quality improvement initiatives.
- IHI Science of Improvement: Establishing Measures. This Institute for Healthcare Improvement (IHI) resource provides information on quality improvement measurement, sampling, and basic data interpretation.
- IHI Run Chart Tool: This IHI tool includes an Excel template and instructions for creating a run chart to display quality improvement data.
- IHI Run Chart Rules Reference Sheet: This IHI resource provides succinct rules for interpreting run charts.
- NICHQ - Introduction to Using Control Charts: This NICHQ resource provides an overview of control charts, a statistical tool for analyzing quality improvement data.
Model for Improvement and Breakthrough Series Model
The most widely used and popular QI methodology is the Model For Improvement. The Model For Improvement askes three fundamental questions:
- What are we trying to accomplish? (AIMS)
- How will we know that a change is an improvement? (MEASURES)
- What change can we make that will result in improvement? (IDEAS)
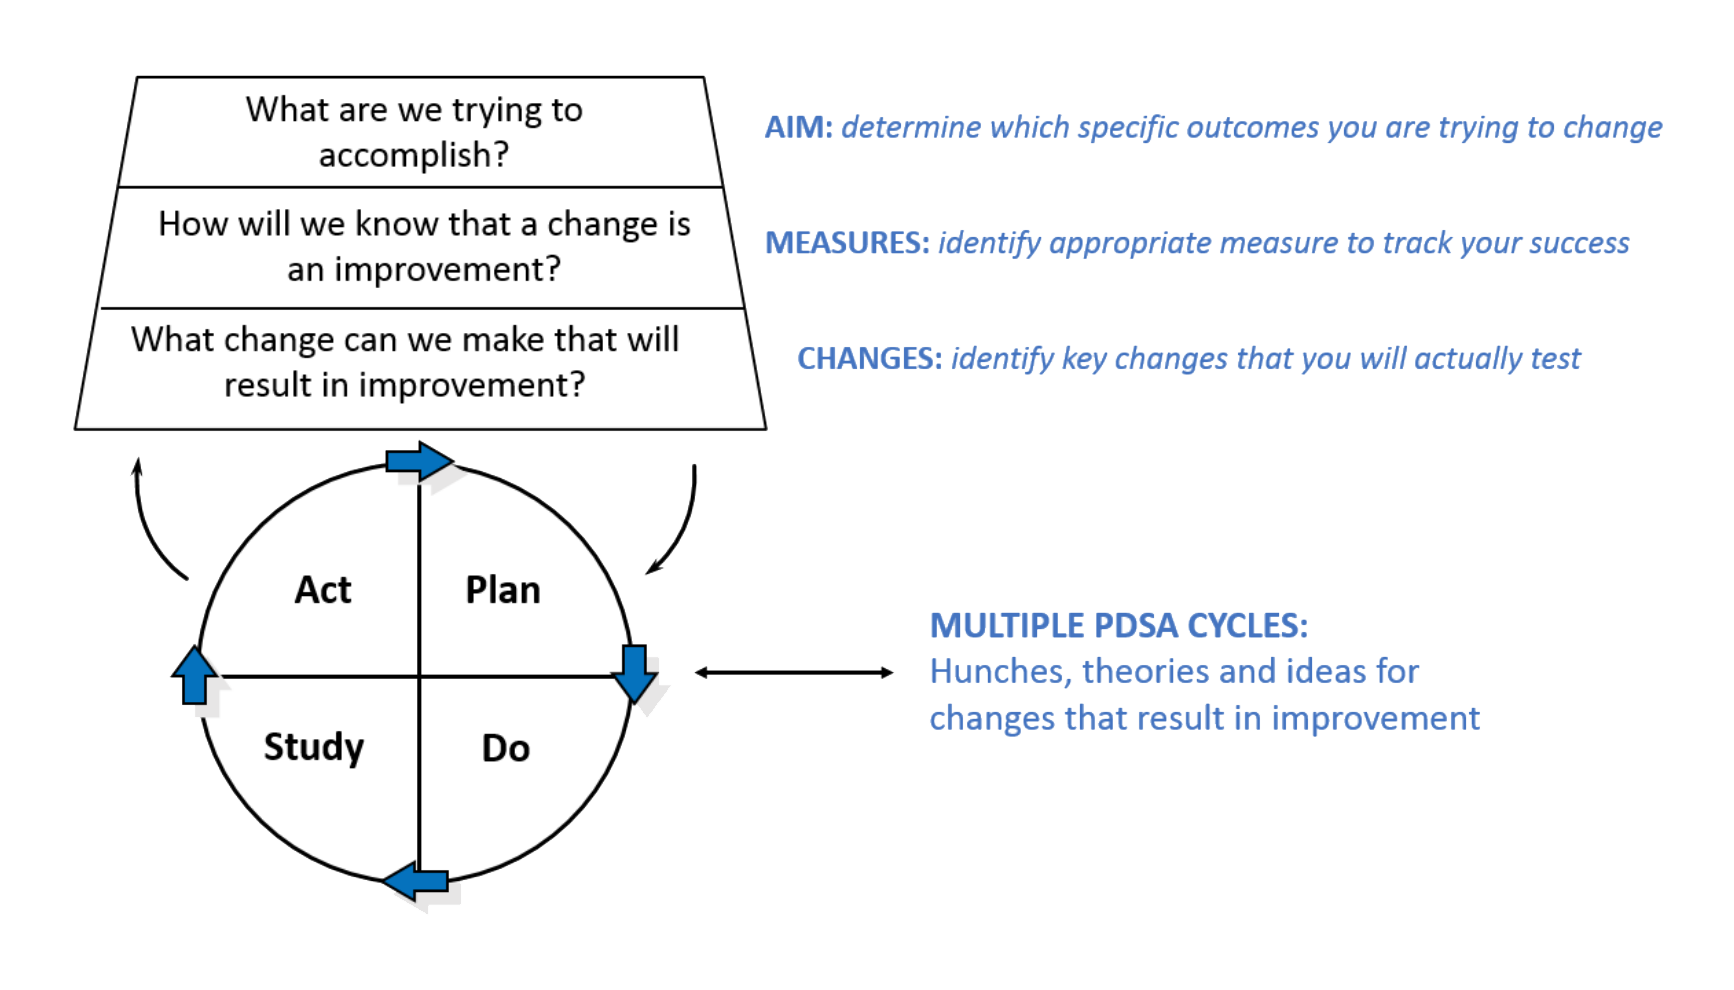
Source: Langley GL, Moen RD, Nolan KM, Nolan TW, Norman CL, and Provost LP. The Improvement Guide: A Practical Approach to Enhancing Organizational Performance. 2nd Edition. San Francisco, CA: Jossey-Bass; 2009
The answers to these three questions will help your team determine quality improvement aims (question 1) and related measures (question 2). Then, you can brainstorm specific ideas (question 3) that your team can test through Plan-Do-Study-Act cycles to see if they help your team accomplish its aim.
Breakthrough Series Model (BTS)
The Institute for Healthcare Improvement (IHI) developed the BTS model in 2003 to help healthcare organizations make “breakthrough” improvements in quality while also reducing costs.
A Breakthrough Series Collaborative is a short-term (6- to 15-month) learning health system that brings together a large number of teams from hospitals or clinics to seek improvement in a focused topic area. The QI Collaboratives can range in size from a small learning network (5-10 healthcare teams) to a large learning network which can include hundreds of healthcare teams. The Quality Networks learning networks vary in sizes of 10-175 teams. These teams typically participate in Learning Sessions over the course of the Collaborative and allow for peer-to-peer learning and discussion. Below is a visual representation of a BTS Model Project in the Quality Networks.
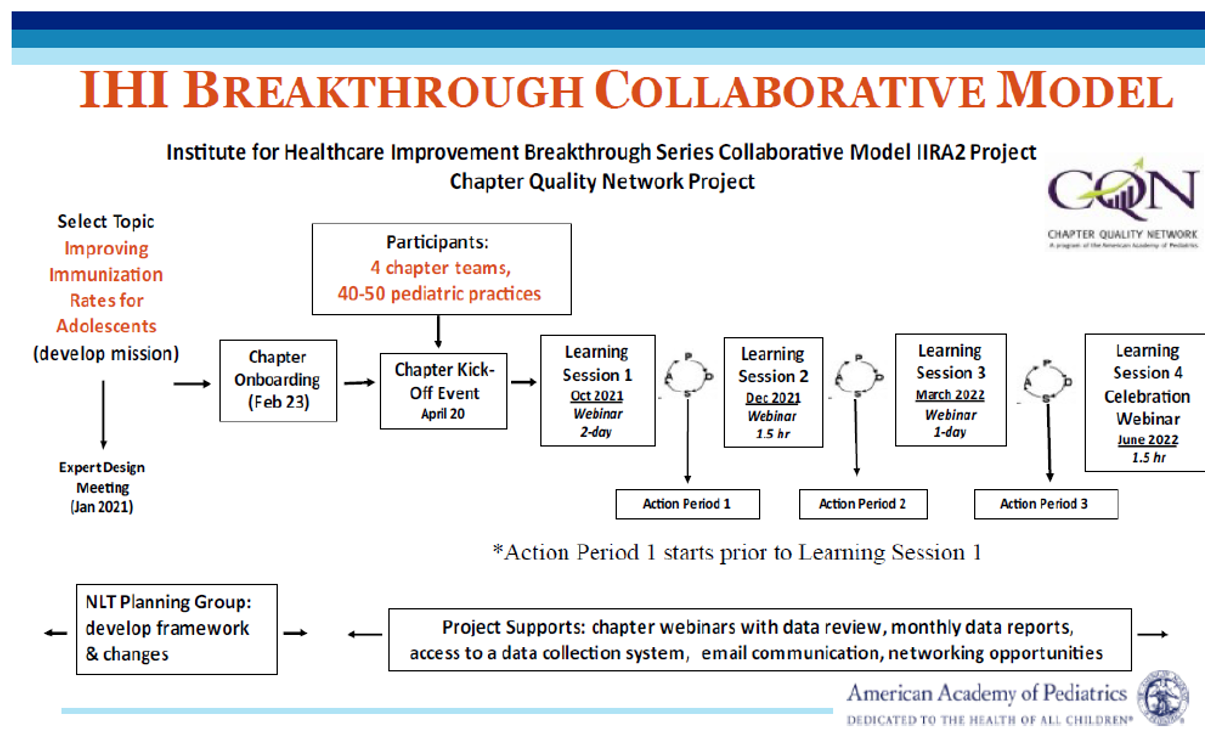
To learn more about the Breakthrough Series Model, read the BTS whitepaper from IHI. To access this resource you need to create a free account with IHI.
The Breakthrough Series: IHI’s Collaborative Model for Achieving Breakthrough Improvement. IHI Innovation Series white paper. Boston: Institute for Healthcare Improvement; 2003. (Available on www.IHI.org)
Quality Improvement Glossary
Action Period
The period of time between learning sessions. During these periods, practice teams work on improvement in their practice or office settings. These teams are supported by the collaborative leadership (project team) and collaborate with other core QI teams on webinars.
Aim
A written, measurable, and time-sensitive statement of the expected results of an improvement process.
Change Concept
A general idea for changing a process. Change concepts are usually at a high level of abstraction but evoke multiple ideas for specific processes. “Simplify,” “reduce handoffs,” and “consider all parties as part of the same system,” are all examples of change concepts.
Key Changes
The list of essential process changes that will help lead to breakthrough improvement.
Key Driver Diagram
The Key Driver Diagram organizes the theory of improvement for a specific aim. It is a way to organize and visualize the relationship between the project’s goal, the high-level changes that will get you to your goal (key drivers), and the specific activities that a practice needs to complete (interventions). The key drivers provide a focus for changes to test. The CQN Immunization key driver diagram was developed to identify pathways to improve coverage rates and overall immunization care.
Learning Session
In a project, there are potentially two types of learning sessions. Face-to-face learning sessions and/or web-based, virtual learning sessions, hosted by faculty, during which participating core QI teams will learn and practice foundational information and skills for the project.
We call these learning sessionsrather than training workshops, asthese sessions are designed to optimize learning amongst the participating core QI teams, highlight successes, and share storiesto learn from one another. Core QI teamsleave these meetings with new knowledge, skills, and materialsthat prepare them to make immediate changes.
Implementation
Testing a change and making it a permanent part of the system. A change may be tested first and then implemented throughout the organization. Key Changes: The list of essential process changes that will help lead to sustainable system improvement.
Measure
An indicator of change. Key measures should be focused, aligned with the aim, and be reportable. A measure is used to track the delivery of proven interventions to patients and to monitor progress over time.
Model for Improvement
An approach to processimprovement, developed by Associates in Process Improvement, which helps core QI teams accelerate the adoption of proven and effective changes. The model is composed of three foundational questions and PDSA cycles.
PDSA Cycle
A structured way to test a process change in the real work setting. This includes:
- Plan: a specific planning phase;
- Do: a time to try the change and observe what happens;
- Study: an analysis of the results of the trial; and
- Act: devising nextsteps based on the analysis.
This PDSA cycle will naturally lead to the “plan” component of a subsequent cycle.
Process Change
A specific change in a process in the organization. More focused and detailed than a change concept, a process change describes what specific changes should occur. “Institute a pain management protocol for patients with moderate to severe pain” is an example of a process change.
Run Chart
A graphic representation of data over time, also known as a “time series graph” or “line graph.” This type of data display is particularly effective for process improvement activities.
Sampling Plan
A specific description of the data to be collected, the interval of data collection, and the subjects from whom the data will be collected. It emphasizes the importance of gathering samples of data and how to obtain “just enough” information.
Spread
The intentional and methodical expansion of the number and type of people, units, or organizations using the improvements. The theory and application come from the literature on Diffusion of Innovation (Everett Rogers, 1995).
Tests of Change
A small-scale trial of a new approach or a new process. A test is designed to learn if the change results in improvement and to fine tune the change to fit the practice and patients. Tests are carried out using one or more PDSA cycles.
Last Updated
03/02/2026
Source
American Academy of Pediatrics